Predict Shipwreck Survivors
Follow along: Predict Shipwreck Survivors
- Create a new *.ipynb file Jupyter Notebook
- Fill in the content below in the newly created file
- Follow and Execute the example codes
Object
Analysis of factors that distinguish the dead and survivors at the time of shipwreck sinking.
Visualization of correlation between survival rate and each factor.
Predict whether passengers will survive.
Historical Background
Sunk after colliding with an iceberg in the North Atlantic on April 15, 1912.
Of the 2,224 people on board, 1,514 died and 710 survived.
There are many people on board, including rich people, ordinary people, and poor immigrants.
Rooms also range from 1st to 3rd class.
There was a concept of ‘lady first’, so women and children were given priority to board the lifeboat.
Data Analysis
ship_train.csv

Attributes of passengers
passengers’ numbers
survival or not
seat class
name
gender
age
parent/child riding together
siblings/spouse traveling together
fee paid by ticket
Protagonist’s Chance of Survival
Attributes of the protagonist: male, third class, 20 years old…
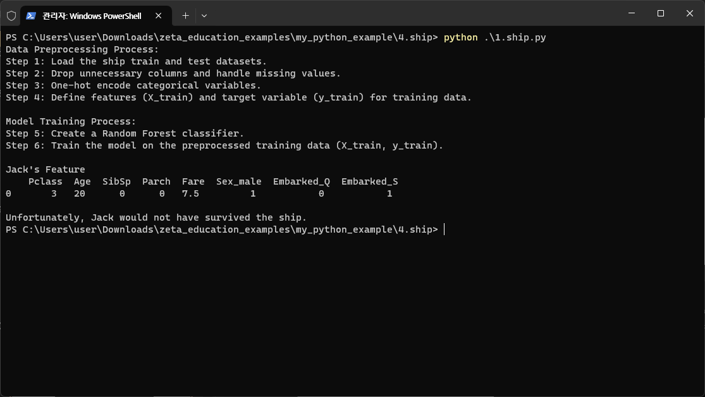
1.ship.py
# What will be Jack's fate?

# Import necessary libraries
import pandas as pd
from sklearn.ensemble import RandomForestClassifier

# File paths
train_file_path = "ship_train.csv"
test_file_path = "ship_test.csv"

# Load the ship train dataset
train_data = pd.read_csv(train_file_path)

# Load the ship test dataset
test_data = pd.read_csv(test_file_path)

# Data preprocessing for training data
# Drop unnecessary columns and handle missing values
train_data.drop(['Name', 'Ticket', 'Cabin', 'PassengerId'], axis=1, inplace=True)
train_data['Age'].fillna(train_data['Age'].median(), inplace=True)
train_data['Embarked'].fillna(train_data['Embarked'].mode()[0], inplace=True)
train_data['Fare'].fillna(train_data['Fare'].median(), inplace=True)
train_data = pd.get_dummies(train_data, columns=['Sex', 'Embarked'], drop_first=True)

# Define features and target variable for training data
X_train = train_data.drop('Survived', axis=1)
y_train = train_data['Survived']

# Create a Random Forest classifier
clf = RandomForestClassifier(n_estimators=100, random_state=42)

# Data preprocessing process
print("Data Preprocessing Process:")
print("Step 1: Load the ship train and test datasets.")
print("Step 2: Drop unnecessary columns and handle missing values.")
print("Step 3: One-hot encode categorical variables.")
print("Step 4: Define features (X_train) and target variable (y_train) for training data.\n")

# Train the model using the training data
clf.fit(X_train, y_train)

# Data preprocessing for test data
# Drop unnecessary columns and handle missing values
test_data.drop(['Name', 'Ticket', 'Cabin'], axis=1, inplace=True)
test_data['Age'].fillna(test_data['Age'].median(), inplace=True)
test_data['Embarked'].fillna(test_data['Embarked'].mode()[0], inplace=True)
test_data['Fare'].fillna(test_data['Fare'].median(), inplace=True)
test_data = pd.get_dummies(test_data, columns=['Sex', 'Embarked'], drop_first=True)

# Model training process
print("Model Training Process:")
print("Step 5: Create a Random Forest classifier.")
print("Step 6: Train the model on the preprocessed training data (X_train, y_train).\n")

# Define the characteristics of our fictional character, Jack
jack_features = pd.DataFrame({
    'Pclass': [3],
    'Age': [20],
    'SibSp': [0],
    'Parch': [0],
    'Fare': [7.5],
    'Sex_male': [1],
    'Embarked_Q': [0],
    'Embarked_S': [1]
})

print("Jack's Feature\n", jack_features, "\n")

# Make a prediction for Jack using the trained model
jack_survival_prediction = clf.predict(jack_features)

# Display the initial prediction
if jack_survival_prediction[0] == 1:
    print("Jack would have survived the ship!")
else:
    print("Unfortunately, Jack would not have survived the ship.")
Let’s Change the Protagonist’s Fate
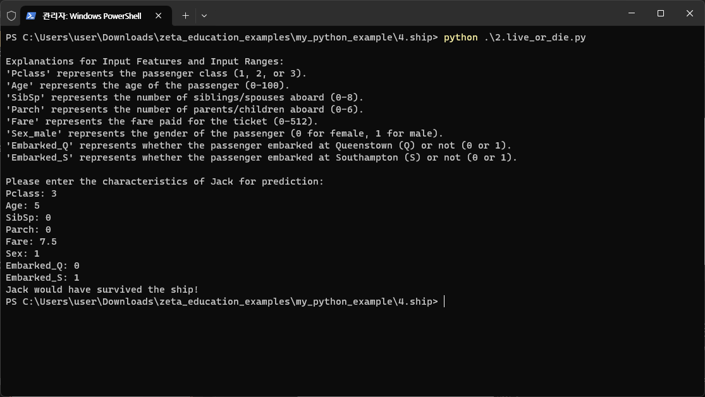
2.live_or_die.py
# Let's change Jack's fate!

# Import necessary libraries
import pandas as pd
from sklearn.ensemble import RandomForestClassifier

# File paths
train_file_path = "ship_train.csv"
test_file_path = "ship_test.csv"

# Load the ship train dataset
train_data = pd.read_csv(train_file_path)

# Load the ship test dataset
test_data = pd.read_csv(test_file_path)

# Data preprocessing for training data
# Drop unnecessary columns and handle missing values
train_data.drop(['Name', 'Ticket', 'Cabin', 'PassengerId'], axis=1, inplace=True)
train_data['Age'].fillna(train_data['Age'].median(), inplace=True)
train_data['Embarked'].fillna(train_data['Embarked'].mode()[0], inplace=True)
train_data['Fare'].fillna(train_data['Fare'].median(), inplace=True)
train_data = pd.get_dummies(train_data, columns=['Sex', 'Embarked'], drop_first=True)

# Define features and target variable for training data
X_train = train_data.drop('Survived', axis=1)
y_train = train_data['Survived']

# Create a Random Forest classifier
clf = RandomForestClassifier(n_estimators=100, random_state=42)

# Train the model using the training data
clf.fit(X_train, y_train)

# Data preprocessing for test data
# Drop unnecessary columns and handle missing values
test_data.drop(['Name', 'Ticket', 'Cabin'], axis=1, inplace=True)
test_data['Age'].fillna(test_data['Age'].median(), inplace=True)
test_data['Embarked'].fillna(test_data['Embarked'].mode()[0], inplace=True)
test_data['Fare'].fillna(test_data['Fare'].median(), inplace=True)
test_data = pd.get_dummies(test_data, columns=['Sex', 'Embarked'], drop_first=True)

# Explanations for input features
print("\nExplanations for Input Features and Input Ranges:")
print("'Pclass' represents the passenger class (1, 2, or 3).")
print("'Age' represents the age of the passenger (0-100).")
print("'SibSp' represents the number of siblings/spouses aboard (0-8).")
print("'Parch' represents the number of parents/children aboard (0-6).")
print("'Fare' represents the fare paid for the ticket (0-512).")
print("'Sex_male' represents the gender of the passenger (0 for female, 1 for male).")
print("'Embarked_Q' represents whether the passenger embarked at Queenstown (Q) or not (0 or 1).")
print("'Embarked_S' represents whether the passenger embarked at Southampton (S) or not (0 or 1).\n")

# Define the characteristics of our fictional character, Jack
print("Please enter the characteristics of Jack for prediction:")
jack_features = pd.DataFrame({
    'Pclass': [int(input("Pclass: "))],
    'Age': [int(input("Age: "))],
    'SibSp': [int(input("SibSp: "))],
    'Parch': [int(input("Parch: "))],
    'Fare': [float(input("Fare: "))],
    'Sex_male': [int(input("Sex: "))],
    'Embarked_Q': [int(input("Embarked_Q: "))],
    'Embarked_S': [int(input("Embarked_S: "))]
})

# Make a prediction for Jack using the trained model
jack_survival_prediction = clf.predict(jack_features)

# Display the prediction
if jack_survival_prediction[0] == 1:
    print("Jack would have survived the ship!")
else:
    print("Unfortunately, Jack would not have survived the ship.")
Survival Probability Prediction by Room Class
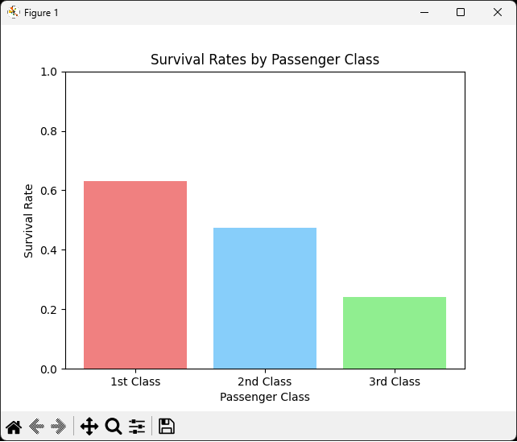
- Survival Probability Prediction by Room Class
1st class: 6x.xx%
2nd class: 4x.xx%
3rd class: 2x.xx%
- guess
People who buy luxury rooms are relatively wealthy: May have items advantageous for survival.
The upper class rooms have better facilities than the lower class rooms: Being located on the top floor of the ferry may have been advantageous for survival.
In that era, many people immigrated: Communication may have been difficult in lower class rooms due to different languages.
3.class.py
# Survival probability estimation chart by seating class

# Import necessary libraries
import pandas as pd
import matplotlib.pyplot as plt

# File paths
train_file_path = "ship_train.csv"
test_file_path = "ship_test.csv"

# Load the ship train dataset
train_data = pd.read_csv(train_file_path)

# Data preprocessing for the training data
# Drop unnecessary columns and handle missing values
train_data.drop(['Name', 'Ticket', 'Cabin', 'PassengerId'], axis=1, inplace=True)
train_data['Age'].fillna(train_data['Age'].median(), inplace=True)
train_data['Embarked'].fillna(train_data['Embarked'].mode()[0], inplace=True)
train_data = pd.get_dummies(train_data, columns=['Sex', 'Embarked'], drop_first=True)

# Calculate survival rates by class
survival_rates = train_data.groupby('Pclass')['Survived'].mean()

# Create a bar chart to visualize survival rates
plt.bar(survival_rates.index, survival_rates.values, color=['lightcoral', 'lightskyblue', 'lightgreen'])
plt.xlabel('Passenger Class')
plt.ylabel('Survival Rate')
plt.title('Survival Rates by Passenger Class')
plt.xticks(survival_rates.index, labels=['1st Class', '2nd Class', '3rd Class'])
plt.ylim(0, 1)
plt.show()
Survival Probability Prediction by Gender
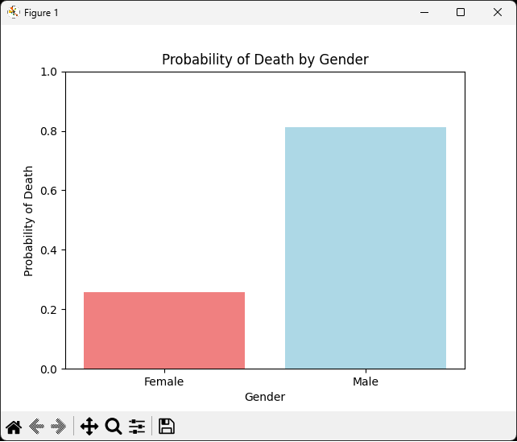
- Survival Probability Prediction by Gender
Female: 2x.xx%
Male: 8x.xx%
- guess
Protecting women first with the spirit of ‘lady first’: Women have a higher chance of surviving within a limited period of time.
The mother boarded the lifeboat as the children’s guardian: Women have a higher chance of surviving with their children.
Powerful men participate in relief efforts (ex. breaking down doors): Increased risk of death from sudden influx of seawater
4.gender.py
# Probability of death estimation chart by gender

# Import necessary libraries
import pandas as pd
import matplotlib.pyplot as plt

# File paths
train_file_path = "ship_train.csv"
test_file_path = "ship_test.csv"

# Load the ship train dataset
train_data = pd.read_csv(train_file_path)

# Data preprocessing for the training data
# Drop unnecessary columns and handle missing values
train_data.drop(['Name', 'Ticket', 'Cabin', 'PassengerId'], axis=1, inplace=True)
train_data['Age'].fillna(train_data['Age'].median(), inplace=True)
train_data['Embarked'].fillna(train_data['Embarked'].mode()[0], inplace=True)
train_data = pd.get_dummies(train_data, columns=['Sex', 'Embarked'], drop_first=True)

# Calculate the probability of death by gender
death_probabilities = 1 - train_data.groupby('Sex_male')['Survived'].mean()

# Create a bar chart to visualize the probability of death by gender
plt.bar(death_probabilities.index, death_probabilities.values, color=['lightcoral', 'lightblue'])
plt.xlabel('Gender')
plt.ylabel('Probability of Death')
plt.title('Probability of Death by Gender')
plt.xticks(death_probabilities.index, labels=['Female', 'Male'])
plt.ylim(0, 1)
plt.show()